Hay testing
With thanks to SGS Agriculture & Food Laboratories for providing the analysis specifically for this series.
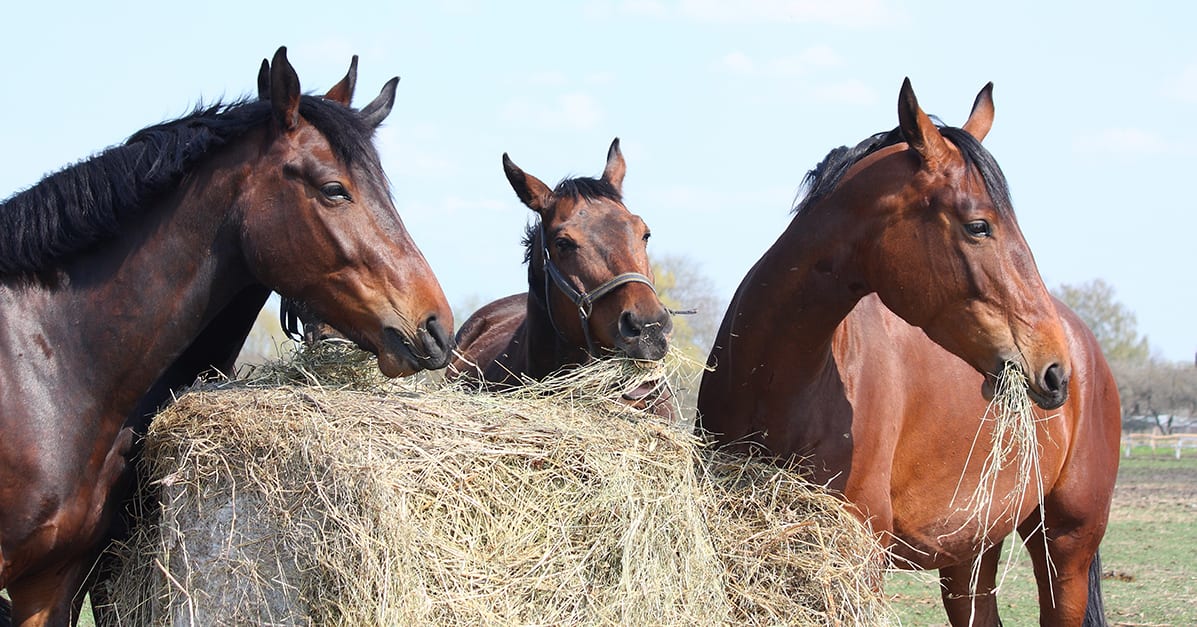
Conserved forages can comprise a large part of the diet of horses; therefore, it is important to review the type and quality of all the roughage we are feeding. Last month, we provided a summary of the roughage sources that are available to horse owners such as hay, chaff, haylage, hay cubes and super fibres.
The type of roughage most suitable for your horse will depend on your horse’s nutritional requirements, the availability of roughage products in your area and the nutritive value of roughage.
In order to predict how well a particular forage will meet the needs of an individual animal, roughages need to be analytically-tested by a specialist laboratory. In the first article of this series, Feed Properties, we highlighted the importance of obtaining the following values: dry matter (DM), digestible energy (DE), crude protein (CP), carbohydrate composition and mineral content.
Hay testing
For this and next month’s articles, we collected and analysed four types of hay – two different types of grass hay, a cereal hay and prime lucerne.
This article will focus on reviewing the results of the laboratory analysis and, based on these results, next month’s article will discuss which of the forage types would be more suitable for different types of horses, performance, breeding and growing horses, as well as those that are sugar-sensitive or have metabolic disorders, such as Laminitis, insulin resistance (IR), tying-up, Cushing’s disease or Equine Metabolic Syndrome (EMS).
Hay samples
The forages we sent in for testing to the SGS laboratory were all grown and harvested in 2013 in the South East Queensland region.
1st Batch: The first batch of hay we tested was a mixed native pasture hay baled especially for horses. It consisted of 60-70% native species, such as Queensland blue grass, windmill grass and slender rats tail or native Parramatta grass, with 40-30% improved pasture species, such as Gatton/Green panic, Rhodes grass and ryegrass.
2nd Batch: The Gatton/Green panic hay we tested comprised 95% panic grasses with some Rhodes grass.
3rd Batch: We also chose a cereal (wheat) hay that was available at a local produce store and is commonly fed in chaff form to horses.
4th Batch: The last batch of hay we tested was ‘prime lucerne’ harvested in the same local area.
In order to have your hay analysed, you need to collect samples that represent the whole batch and cut enough hay into suitably sizez pieces for the laboratory to work with. Usually, the laboratories that offer hay testing provide you with a kit and instructions on how to collect the samples.
The general advice is to use a hay probe that drills deep into the bale and cuts the hay into large chaff size pieces. You should collect samples from between 10 and 20 bales (depending on how many bales you have available).
It is important that you probe each square bale in the centre of the small end between the strings. With large round bales you could take two samples, one from each end of the side.
The samples from the different bales should be thoroughly mixed and divided into two clearly labelled plastic ziplock bags, each sample bag weighing approximately 100 grams. This can then be mailed to the laboratory.
In our case, the samples were analysed at the SGS Agriculture & Food laboratory in Toowoomba, Queensland (www.sgs.com.au).
Test results
The results of the nutrient analysis of the four types of hay are detailed in Table 1 on the next page (see the complete article by clicking the main image).
Laboratories will usually report the results based on dry matter. Transforming the dry matter value to an “as fed’”or “as received’”value is quite easy and a lot more practical.
All feedstuffs and forages contain water (moisture). This also includes hay and silage, and the content in the various feeds and forages can vary tremendously. Nutrient analyses expressed as “as fed” or “as received” include this water component. As the water content increases in a feedstuff, the amounts of other nutrients present per kilogram of that feedstuff decrease. In contrast, feed and forage nutrient analyses expressed as “dry matter” represent the percentages of nutrients present excluding the water or moisture content.
Lets take our native hay for example:
If we have 63 g/kg of crude protein (CP) on a dry matter basis, then we have to multiply that by the dry matter expressed in the result – in this case 0.841 (84.1% dry matter/100%). The result is 53 g/kg on an “as fed” basis. This means that if you feed 1 kg of this native hay to your horse, it receives about 53 grams of crude protein.
Dry matter content of a feedstuff is important because it reveals the actual amounts of the various nutrients available to the animal consuming the feed. “As fed” represents the feed or forage as it is fed to the animal, including the moisture content. It is still important to remember, however, that this will not provide a good indication of the nutrient composition of the non-water feed components, particularly when the moisture content is high.
Reviewing the nutrient content of the forages tested
Energy & protein
Energy and protein are usually the first two major constituents we look at. As you can see, grass hays are slightly lower in energy and protein than the cereal and lucerne hays.
Lysine
Lysine is one of the 20 amino acids essential to horses, but is often the most deficient in their diets due to its inadequate levels in commonly-fed cereal grains. Amino acids are the building blocks of protein, which form muscle, enzymes, and hormones throughout the body. As you can see, although feed products will differ in the composition of amino acids, those that are higher in protein, such as lucerne hay (legume forages) will also contain more of these amino acid building blocks.
Fats
Although grasses and hay contain low levels of fats and/or oils, most of the fat is made up of omega-3 fatty acids. The forages we analysed all have similar quantities of between 14 and 16 grams per kilogram of dry matter.
Fibre
As nutritionists, we always highlight that fibre is the most important ingredient in the horse’s diet, so let’s review the fibre content of these four different forages.
Acid Detergent Fibre (ADF) & Neutral Detergent Fibre (NDF)
Acid Detergent Fibre (ADF) and Neutral Detergent Fibre (NDF) provide empirical estimates of the less digestible structural carbohydrates (fibre) in forages.
Of the two, ADF is the least digestible plant component and consists mainly of cellulose and lignin with small amounts of nitrogen and minerals. The NDF fraction includes the hemicelluloses in addition to the ADF component of plant tissue. Lignin is the highly indigestible faction of forages and other roughages.
As you can see, the NDF fraction is higher in the grass hays compared to the cereal and lucerne hays. ADF is also higher for the grass hays compared to the cereal hay, but appears to be similar to the lucerne hay. The lignin content of the lucerne hay is lower than that of the grass hays.
ADF values are inversely related to digestibility, so forages with low ADF concentrations are usually higher in energy. When evaluating the digestible energy, it is important to also take into account the crude protein and total NDF content. In this case, the lucerne hay may have been cut at a more mature stage – it had a higher ADF. You would find lower ADF levels with earlier cut forages.
Non-structural carbohydrates (NSC)
The non-structural carbohydrate (NSC) fraction has been the main focus when reviewing digestible carbohydrates and simple sugars in horse forages and feeds. This part of the analysis will be of particular interest to those horse owners that manage horses that are sugar-sensitive or have metabolic disorders.
Although NSC always gets a mention when talking about sugar-sensitive horses, it is actually not the best measure to evaluate the carbs in your horse’s diet.
One major reason is the large variation in the way different laboratories measure NSC components and calculate its value, which makes it impossible to compare results. Another is that an NSC value doesn’t provide you with the complete picture of the types of carbohydrates in the feed or forage, and how they affect the horse’s particular condition.
NSC values are usually calculated as water-soluble carbohydrates (WSC) + starch, or ethanol-soluble carbohydrates (ESC) + starch. They include nearly all the non-fibre carbohydrates that originate from the plant cell content and are easily digested.
Some carbohydrates though are digested in the small intestine of the horse (the so-called hydrolysable carbohydrates; CHO-H), whereas others pass on to the hindgut (the so-called rapidly fermentable carbohydrates; CHO-FR)1.
Thus, they affect the horse’s blood sugar and gastrointestinal health differently. This is why it is important to evaluate them separately. (Read Part 1 of the Choosing Hay series, Feed Properties, for a more detailed breakdown of the indigestible and digestible carbohydrates, and how they affect digestion).
Water-soluble carbohydrates (WSC) & ethanol-soluble carbohydrates (ESC)
By reviewing the WSC and ESC fractions instead of the NSC, we get a more complete picture of the digestible carbohydrates and simple sugars, and how they will affect the horse’s metabolic and digestive systems.
WSC – these include carbohydrates that are extracted from a sample by dissolving them in water. This measure is made up of simple sugars and fructans, and are sometimes simply termed “sugar”.
Interpreting and using this value depends on the proportions of sugars and fructans in the sample:
- Simple sugars are digested and absorbed in the small intestine and have a significant impact on blood sugar levels (what’s called the glycemic response);
- while fructans are fermented in the large intestine and induce a much smaller response. When eaten in large amounts though, some fructans have been shown to cause Laminitis due to the disruption of the bacterial population in the large intestine. Fructans are rarely analysed separately from other WSC.
ESC – these carbohydrates are soluble in 80% ethanol. They are a subset of WSC that is primarily digestible in the small intestine and includes much fewer fructans. As such, this fraction is generally used to evaluate one set of carbohydrates in a feed that will induce a high glycemic response.
Starch
In this exercise we did not analyse for starch because the starch content of forages is low, so this analysis is generally only done in grain products and commercial feeds.
Starch is made up of many glucose molecules with starches being mostly broken down to single glucose molecules. This means they also induce a high glycemic response. As mentioned earlier, NSC values have been calculated by adding starch to either WSC or ESC.
So what does all this mean?
If you have low values of ESC and starch, there will be little glucose available to be absorbed from the small intestine and hence a lower glycemic response (what is commonly referred to as a low GI food). This is good for those horses that can’t handle large amount of sugars (e.g. insulin-resistant horses).
If we have low WSC and starch then only small amounts of material will reach the large intestine that will be rapidly fermented. There will be less opportunity for large intestinal disturbance. These feeds would be good for laminitic horses.
As you can see from our analysis results, the native pasture hay mix has the lower values for both ESC and WSC compared to the other forages. The cereal hay has significantly higher values.
Nothing comes without a disclaimer though, and so it should be noted that the CHO-H fraction that is normally digested in the small intestine can actually end up in the hindgut of the horse, where it will be rapidly fermented (with the associated risk of Laminitis and Colic). This will depend on the digestibility and the quantity of feed ingested in a single meal.
This is why it is not only important to analyse the feed (and/or review labels), but also thoroughly review the horse’s complete feed ration formulation, and feed appropriate amounts per meal to reduce potential upset in the hindgut.
It’s all in the interpretation
Despite all we know, one of the main problems facing horse owners is determining what are actually low or high carb values. Unfortunately, there is no standardisation across the industry (in Australia and internationally). As mentioned earlier, this is partly due to the significant variations in the way different laboratories measure non-fibre carbohydrate components and calculate its value. Researchers have suggested that complete rations (hay, grain and supplements) should contain less than 12 and 10% NSC for horses affected with Laminitis2 and some forms of tying up3, respectively.
As a response to the need for lower NSC feed products, organisations such as the Laminitis Trust have emerged to advise on “safe” levels in horse feed products, as well as feeding guidelines for metabolically-challenged horses. However, for the many horse owners that manage sugar-sensitive horses or horses with metabolic disorders, this whole NSC dilemma remains quite complicated, especially when there are so many (commercial) products out there.
It is, therefore, advised to consult with an equine nutritionist to review the hay testing analysis and your horse’s diet as a whole, so they can assist you in the decision-making process when it comes to selecting forages and alternative products that could be incorporated in the diet to meet the individual needs of all your horses.
Next month, we will continue by discussing which type of hay would be more suitable for metabolically-challenged horses, as well as the forages that are more appropriate for performance, breeding and growing horses.
References
1. Hoffman, R.M., Wilson, J.A., Kronfeld, D.S. et al. 2001. Hydrolyzable carbohydrates in pasture, hay, and horse feeds: direct assay and seasonal variation. Journal of Animal Science; 79: 500-506.
2. Frank N. 2009. Insulin resistance and equine metabolic syndrome. In Current Therapy in Equine Medicine. Eds. NE Robinson and KA Sprayberry. Elsevier Publications; 727-740.
3. Borgia L, Valberg SJ, Watts K, Pagan J. 2009. Glycemic/insulemic response to feeding hay with different water soluble carbohydrate content in healthy and Polysaccharide Storage Myopathy-affected horses. Journal of Equine Veterinary Science; 29(5): 355-357.
[wpdm_package id=52438 template=”link-template-button.php”]